Dashboard
Description
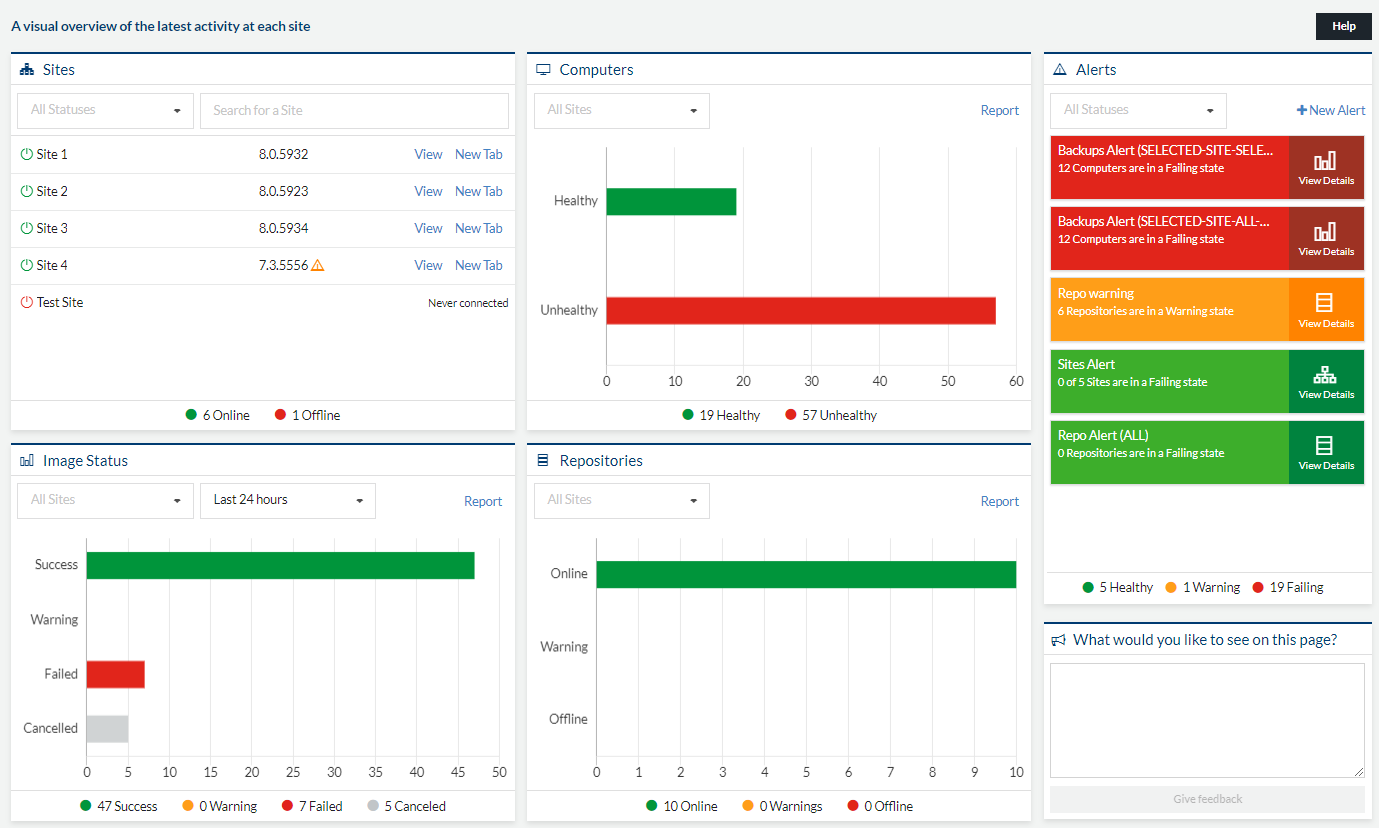
The Dashboard gives you a visual overview of the status of various aspects of your managed Sites, in the form of Widgets.
The Widgets available are:
- Sites - This lists each site along with its connection status and shortcuts to Remote Viewing.
- Image Status - This chart shows a summary of the results of the latest Backups from your Sites and provides a link to a filtered view of the Image Status Report. It can be filtered by Site and date. The date filter, filters by the Last 24 hours, Last 7 days and Last 30 days.
- Computers - This displays a chart showing the health of all of the Computers. You can filter by Site and you can filter the specific report page by clicking on the chart.
- Repositories - This displays a chart showing the health of the connected Repositories.
- Alerts - Alerts can be configured to monitor and display information on Sites Status, Image Status, Computers Health and Repositories Usage.
- Feedback - Widget used to give us quick feedback. We really appreciate it.
There is a Help button in the top bar that gives more information about each Widget.
How do I get here?
- The Dashboard can be accessed using the primary navigation.